앞으로 구현할 Prometheus와 Grafana 개요입니다.
Prometheus
Metrics를 수집하고 모니터링 및 알람에 사용되는 오픈소스 애플리케이션
Pull 방식의 구조와 다양한 Metrics Exporter 제공
시계열 DB에 Metrics 저장 -> 조회 가능
Grafana
데이터 시각화, 모니터링 및 분석을 위한 오픈소스 애플리케이션
시계열 데이터를 시각화하기 위한 대시보드 제공
요약
프로메테우스 & 그라파나 설치
프로메테우스 설정 파일
그라파나에 프로메테우스 연동
다운로드
프로메테우스 (2.33.1) : https://prometheus.io/download/
그라파나 (8.3.4) : https://grafana.com/grafana/download
소스코드
프로메테우스
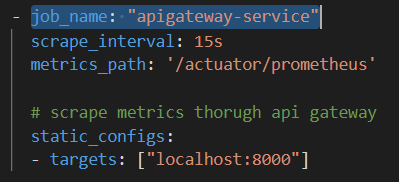
prometheus.yml 수정합니다.
어디서 metrics 데이터를 가져올지 설정해줍니다.
# A scrape configuration containing exactly one endpoint to scrape:
# Here it's Prometheus itself.
scrape_configs:
  # The job name is added as a label `job=<job_name>` to any timeseries scraped from this config.
  - job_name: "prometheus"

    # metrics_path defaults to '/metrics'
    # scheme defaults to 'http'.

    static_configs:
      - targets: ["localhost:9090"]

  - job_name: "apigateway-service"
    scrape_interval: 15s
    metrics_path: '/actuator/prometheus'

    # scrape metrics thorugh api gateway
    static_configs:
    - targets: ["localhost:8000"]

  - job_name: "user-service"
    scrape_interval: 15s
    metrics_path: '/user-service/actuator/prometheus'
    static_configs:
    - targets: ["localhost:8000"]

  - job_name: "order-service"
    scrape_interval: 15s
    metrics_path: 'order-service/actuator/prometheus'
    static_configs:
    - targets: ["localhost:8000"]
프로메테우스 실행합니다.
Mac
./prometheus --config.file=prometheus.yml
Windows
.\prometheus.exe
127.0.0.1:9090 으로 접속하면 프로메테우스 UI를 볼 수 있습니다.
데이터를 조회할 수 있습니다.
그라파나
그라파나 실행합니다.
Mac
./bin/grafana-server.exe
Windows
.\bin\grafana-server.exe
127.0.0.1:9090에 접속하여 서비스를 확인합니다.
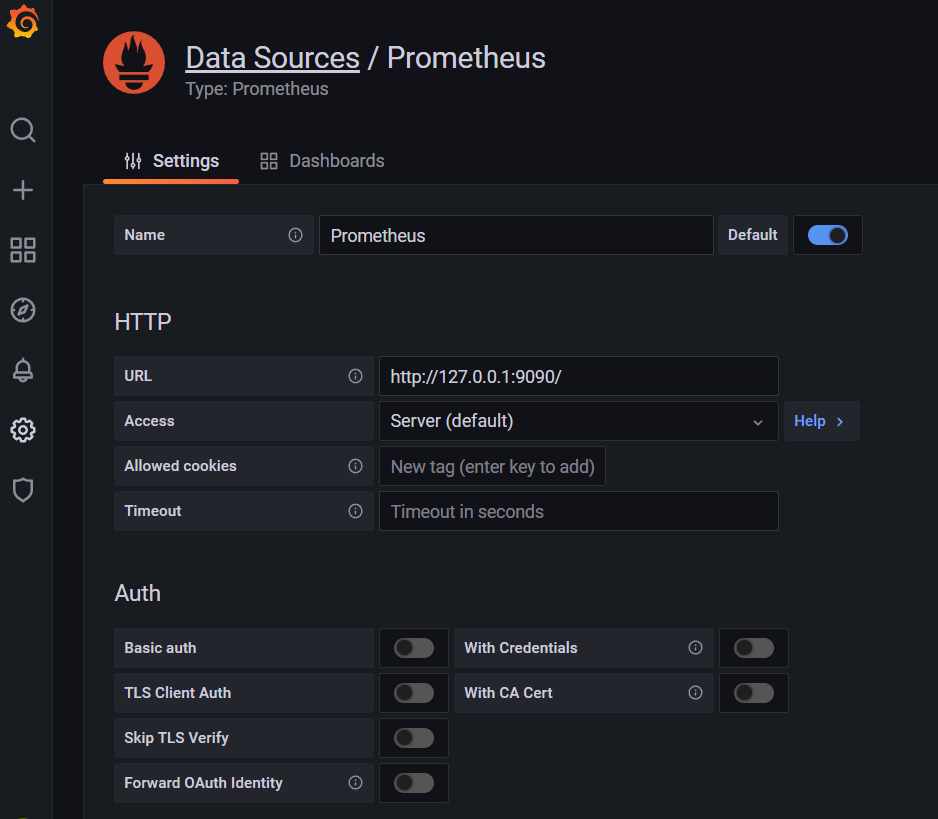
Data Sources로 Prometheus를 추가합니다. URL을 추가하고 'save & test' 버튼을 누릅니다.
Dashboard를 추가합니다. 이미 만들어져 있는 것을 가져와서 사용하겠습니다. Import를 눌러줍니다.

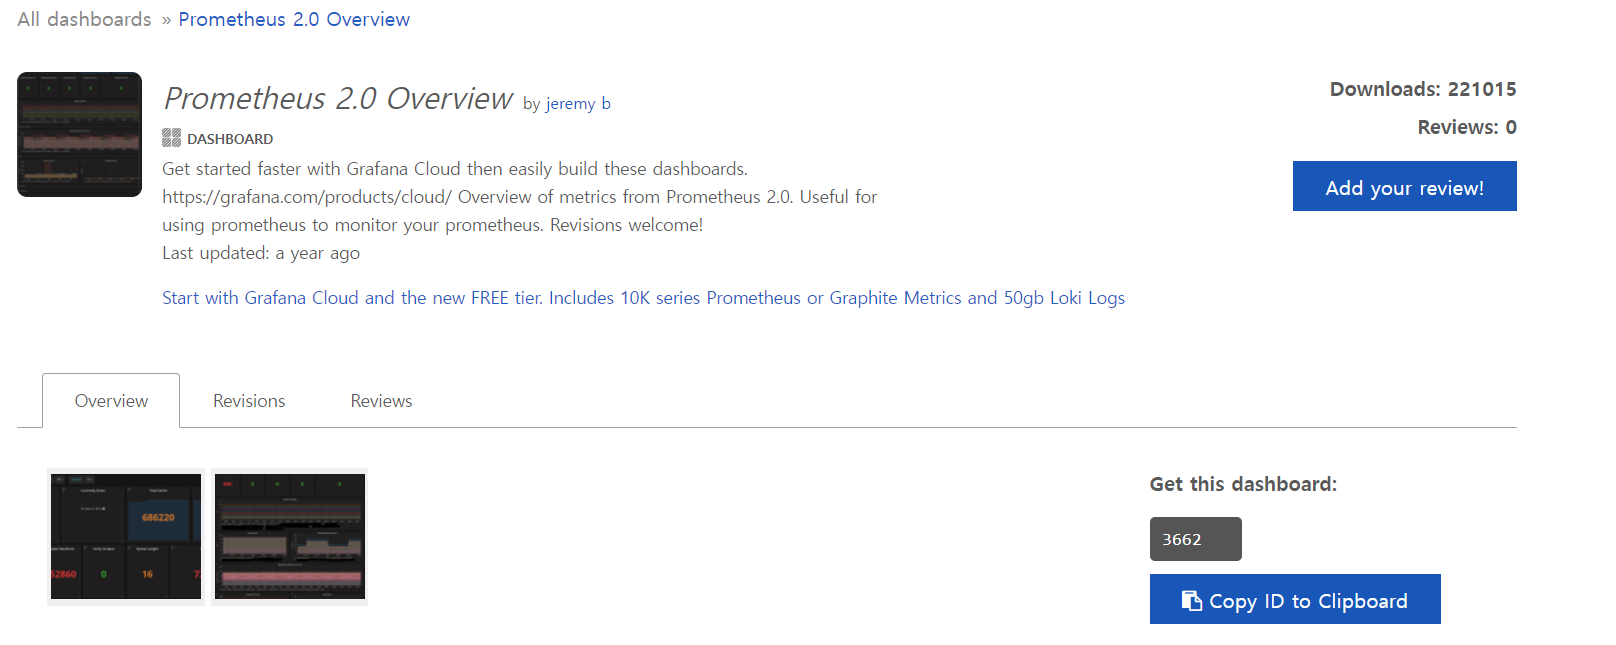
그라파나 홈페이지에서 DashBoard를 찾습니다. micrometer를 검색하여 원하는 것을 선택합니다.

오른쪽 하단에 파란색으로 된 'Copy ID to Clipboard'를 눌러줍니다.

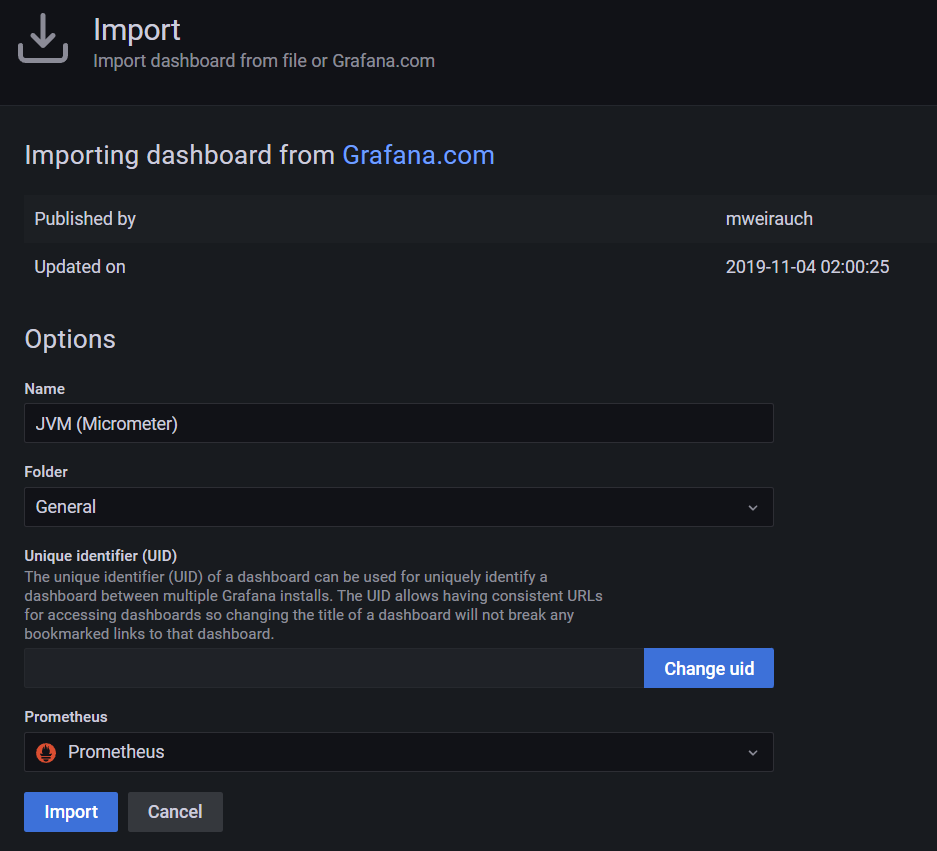
이제 그라파나 서버로 돌아가서 Import 해줍니다. 제일 밑에 Prometheus를 선택해주고 Import 버튼을 눌러줍니다.
다른 대시보드도 추가하겠습니다. Promethues 서버를 모니터링할 수 있는 대시보드를 만들어 줍니다.

마지막으로 하나 더 추가하겠습니다. 동일한 방법으로 Spring Cloud Gateway 대시보드도 만들어 줍니다.

대시보드로 가서 panel을 하나 선택하여 수정해봅니다.

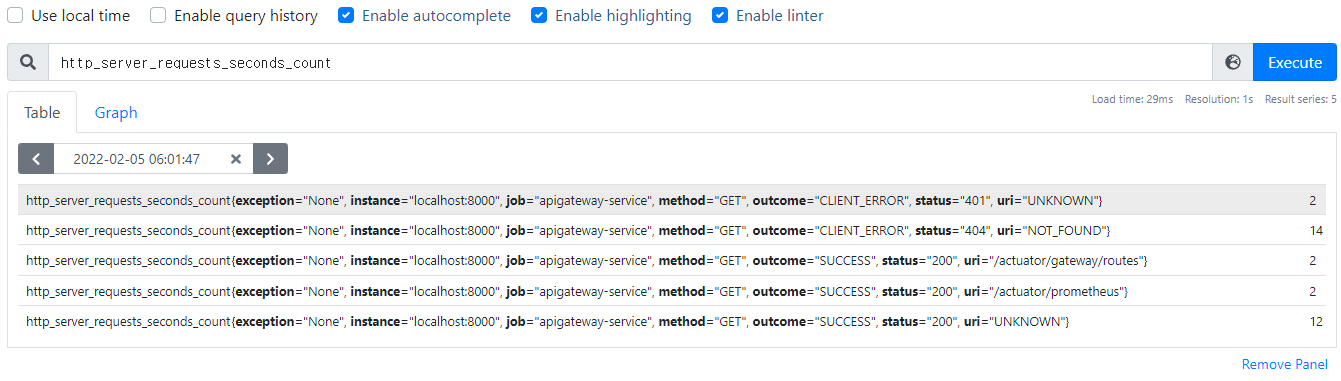
아래 붉은색과 파란색 박스는 프로메테우스에서 가져오는 값들입니다.

붉은색 박스로 표시된 지표의 경우, 프로메테우스에서 검색이 되어야 합니다.

Postman에서도 찾을 수 있습니다.

파란색 박스로 표시된 변수는 프로메테우스에서 조회된 항목을 분류하기 위해서 사용됩니다. 현재는 'job'을 이용하고 있습니다. 이 'job'은 prometheus.yml 에서 확인할 수 있습니다.
수정 전에는 N/A였는데, 이후에는 모니터링되고 있습니다.

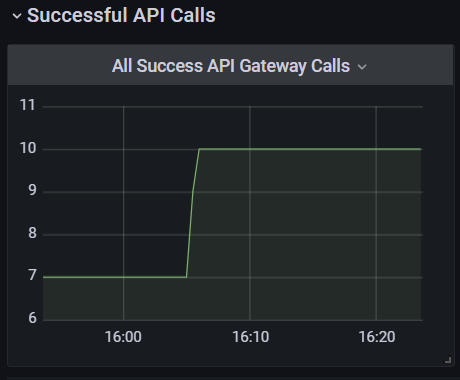
마찬가지 방법으로 Successful API Calls 패널도 만들어 보겠습니다.


끝.
'IT > Spring Cloud' 카테고리의 다른 글
| Spring Cloud Context (0) | 2023.04.03 |
|---|---|
| 컨테이너 가상화 (0) | 2022.02.05 |
| 모니터링 - Micrometer (0) | 2022.02.04 |
| Zipkin - 분산 추적 (0) | 2022.01.30 |
| CircuitBreaker (0) | 2022.01.30 |